I’ve always been interested in the best way to track improvements in my golf game. Yes, handicaps and scoring are results but they do not help me figure out what part of my game needs work. In the past I looked at fairways hit, greens in regulation (GIR), total putts, etc. However, after reading the latest and greatest suggestions from golf stat gurus (like Lou Stagner) I’m tracking my 2025 golf season with a different approach.
Most of the game improvement gurus online will tell you to get a game tracking app or program to track “strokes gained.” For example using Arccos or Shot Scope might be worthwhile; but I am not at a stage where I want to spend money to start tracking strokes gained. So, after reading many articles and books, it seems that there are a few interesting new stats (at least for me) that I can track without much fuss.
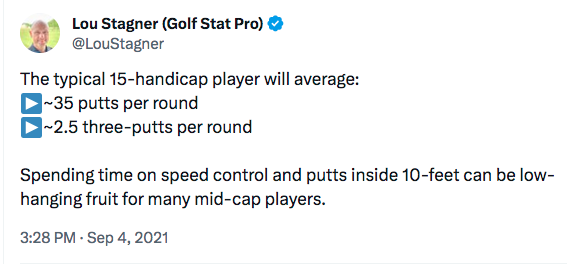
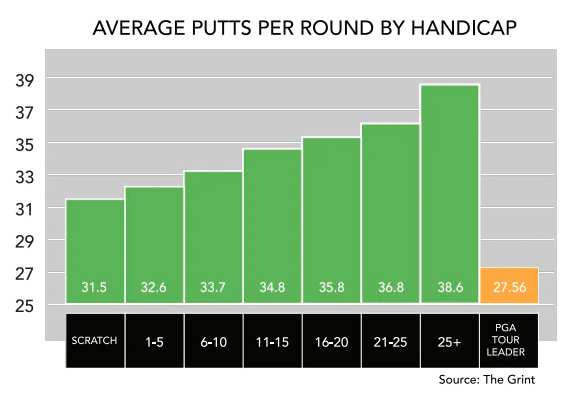
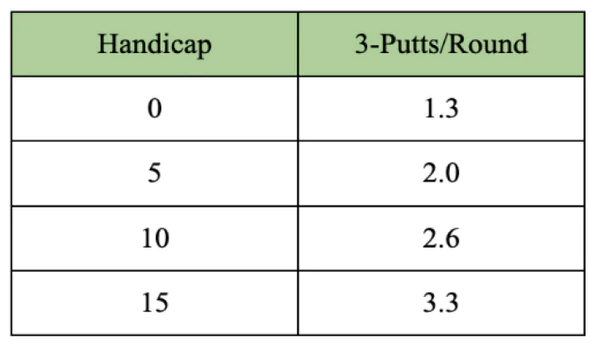
(1) Three-putt Avoidance – A golfers ability to avoid three-putts. You might think what’s wrong with the old school “total putts” statistic? I like the stat but there really isn’t any context and I have realized after tracking three-putts that it is a much better indicator of my putting overall. Focusing on this stat has made me much more aware of how far I am from the hole (proximity) on my first putt which has changed the way I practice my putting. I have become much more focused on speed control. I started tracking this stat in the summer last year and I have greatly improved my putting.
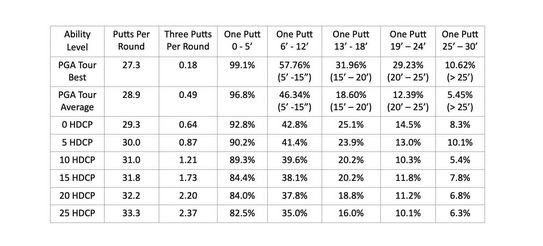
Below is a chart (by handicap) with the statistics (from Lou Stagner) to measure your three-putt avoidance. To calculate the percentage just figure out how many three putts per number of holes. The PGA Tour has been tracking this stat since 1992. For example, the number one player in the world, Scottie Scheffler during the 2024 golf season played 1,278 holes with 24 three-putts or a 3-putt avoidance of 1.88%. It’s interesting that Scheffler is not the best in this category.

Fun Golf Trivia about Three-Putting: Jack Nicklaus in 1962 won his first Major (U.S. Open at Oakmount) in an 18 hole playoff against Arnold Palmer. Jack’s putting was the key to winning. Nicklaus had only one three-putt in 90 holes compared to Palmer who had 10 three-putts that week.
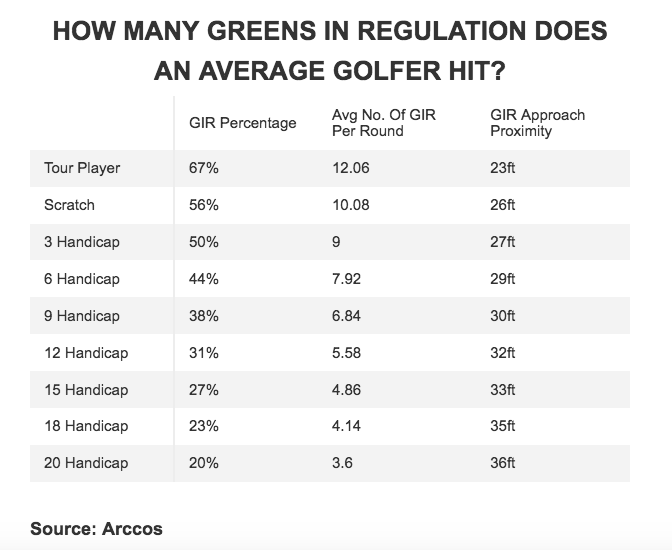
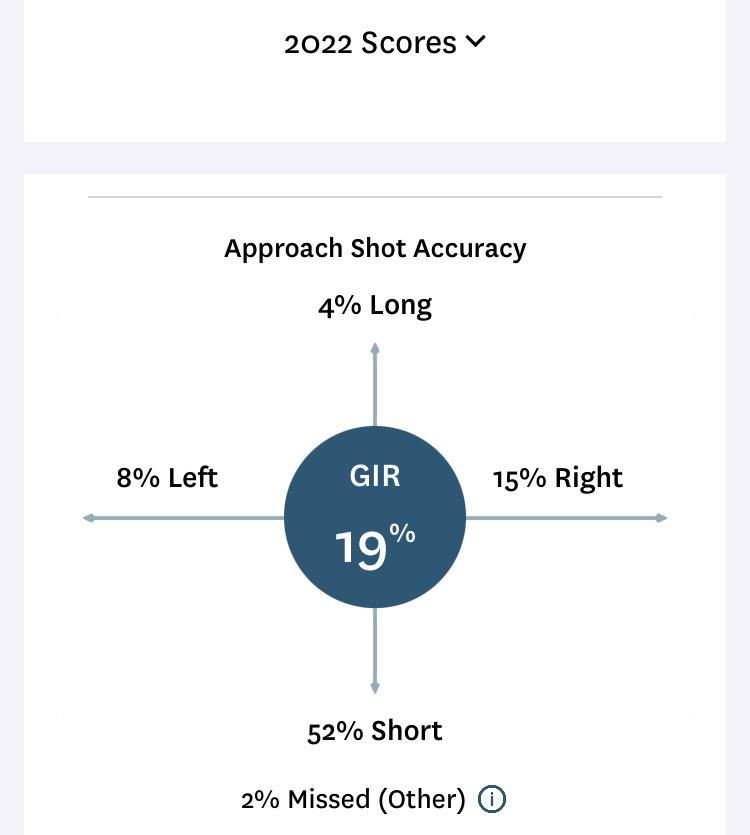
(2) Greens In Regulation Plus One (GIR+1) – The golf articles I have read on game tracking seem to all agree that if you are going to track a traditional stat then track greens in regulation (GIR) because it’s the only traditional stat that correlates to lower scores.
In addition to GIR, I came across a stat to track GIR+1 and I love it. This was a concept I learned from Lou Stagner’s Newsletter (#86).
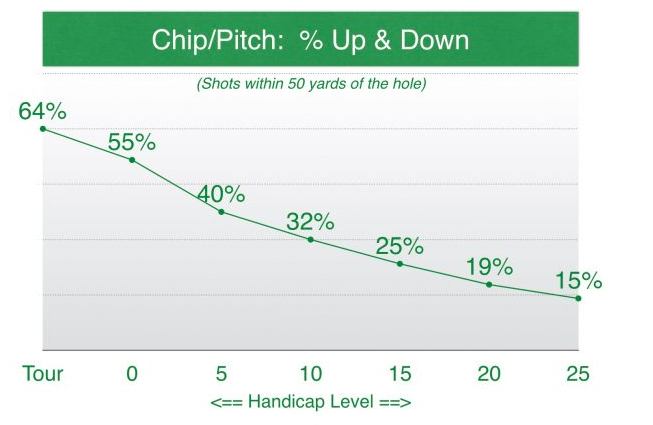
GIR+1 is a statistic that tracks how often you get on a green and give yourself a chance at a par with a one-putt. For me, I still have a GIR goal but I really like tracking GIR+1 for two reasons. First, I’m not the longest hitter and so I get frustrated with how few GIR I have in a round because of my lack of distance versus me hitting a bad shot (e.g., out of bounds, penalty area, lost ball). It doesn’t mean I’ve given up on working on distance but I’m not as obsessed with distance in 2025. I have now been working on my short game to get my proximity to the hole dialed-in from shots just off the green.
Second, GIR+1 is just a positive way for me to look at my post round results and my mental game on course is more positive. Now I find I’m telling myself I still have a chance at par with a one putt versus thinking it’s automatically a bogey because I will two-putt (which I hate to admit was my old mind set). I’m surprised how this different perspective has made the game more enjoyable for me the few times I have played in 2025.
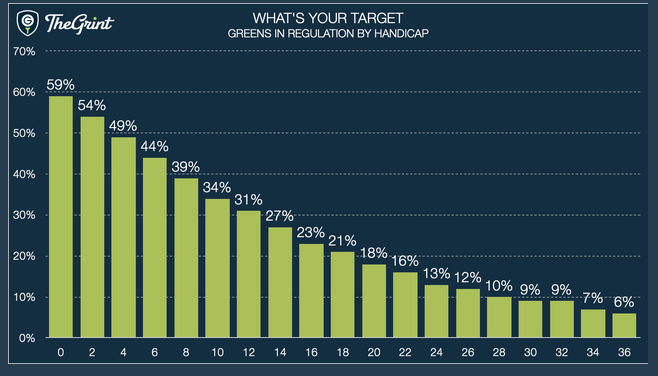
Here is a chart with GIR+1 by Handicap (data from Lou Stagner). Basically, a 20 handicap is giving themselves 11 or 12 chances to save par with a one putt compared to a scratch golfer with 16 or 17 opportunities.

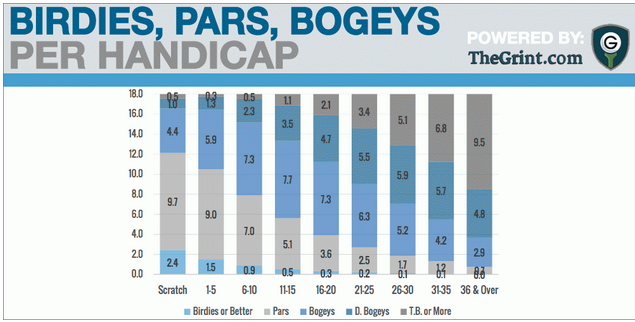
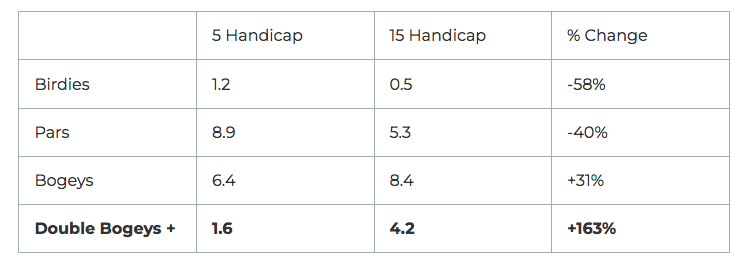
(3) Tracking “Double Bogey or Worse” Data – This may seem odd but I have started tracking double bogey or worse versus focusing on Pars and Birdies. Don’t get me wrong I’m very excited when I have Pars and Birdies but again data shows that even scratch golfers do not make that many birdies in a round. In fact, the experts say the key to good golf is fewer “blowup” holes. So instead of looking at my post round review and being frustrated if I didn’t have a birdie; I now look at my scores and I’m excited if I achieve my 2025 goal of four or less double bogeys (or worse) in my round.
Chart with Bogey and Double Bogey by Handicap (source: Lou Stagner)

So I guess this year the best way to express my personal golf data tracking journey is the focus is really on avoiding blow up holes. I know it makes sense but it is really a different mind set for me. Now I’m really excited to get on a green with a chance at a par with a one-putt. I am very focused on avoiding a three-putt, and try to make sure I’m walking off the green feeling good about a bogey on a hole.
I’ll be very interested to see if at the end of the year, this new approach makes a difference in the numbers every golfer is measured by – handicap and/or average score.